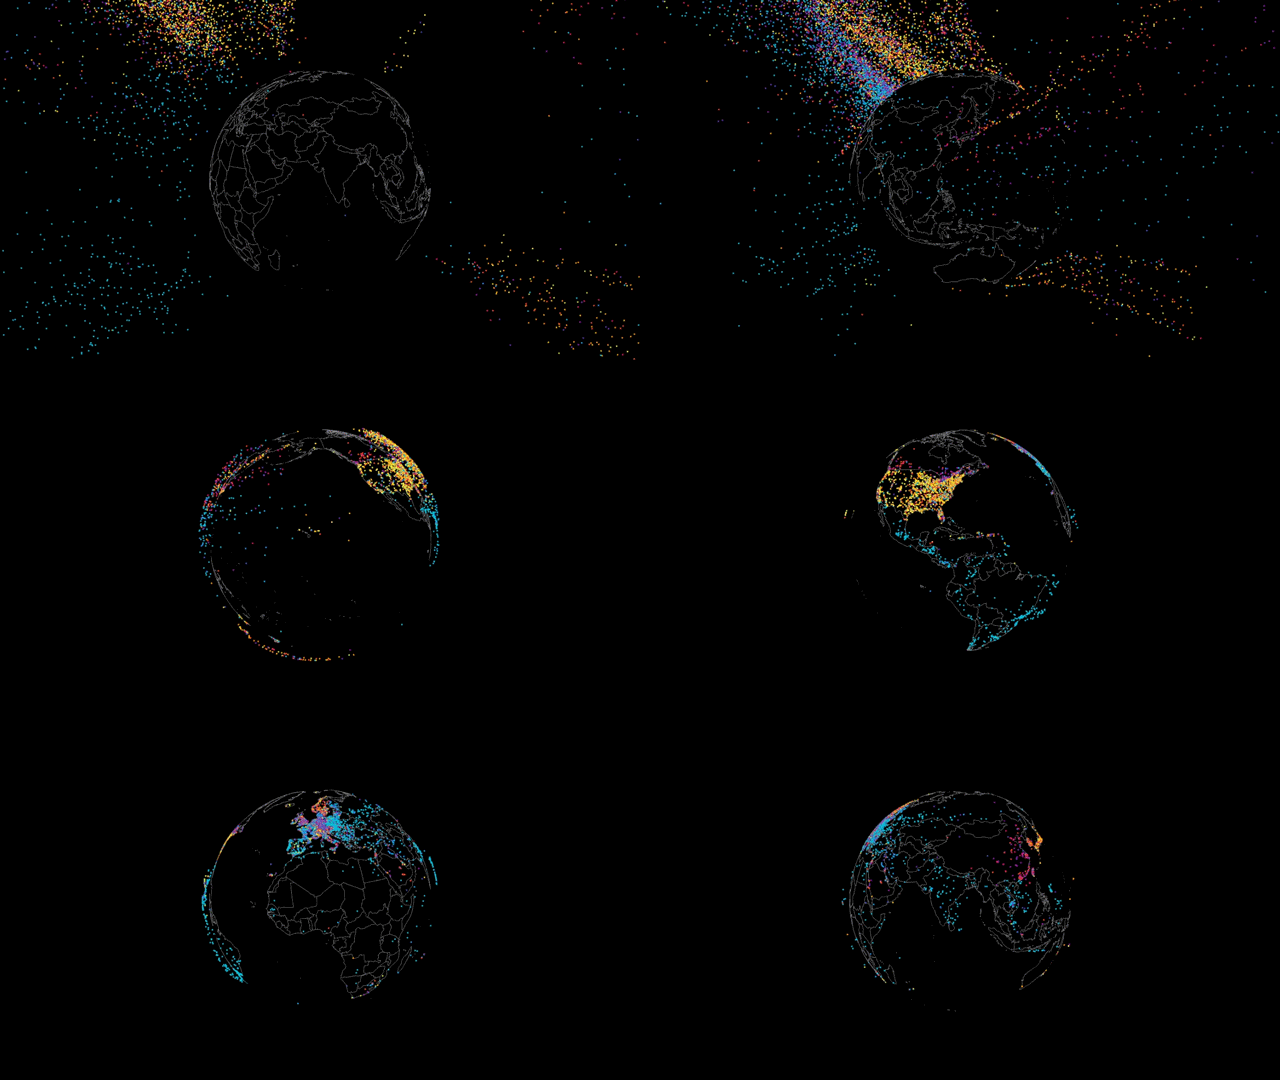
Data Visualization of Android Diversity for Google I/O Keynote
Google Data Arts Team's project, in collaboration with Variable.
A data visualization that showcased the diversity of Android users. The colored dots in the visualization represent the one billion active Android users, the devices they use, and their geographical locations. This visualization was created for the keynote speech by Google CEO Sundar Pichai at Google I/O. The aim was to emphasize the phrase "Be Together, Not The Same", highlighting the variety within the Android ecosystem and its users.
To process the data we had and transform it into visual information, the team at Variable developed custom software. This software enabled us to play the visualizations and animations in real-time in a browser using GPU shaders. (Case study) This approach facilitated online review and seamless collaboration, despite geographical separations and time differences between Europe and the US. The final piece was rendered in high resolution for display on an enormous screen.
My Role:
As a senior design lead on the project, I had a range of responsibilities and was pivotal in steering the project's artistic visual direction. Collaborating closely with a junior designer, we embarked on the task of exploring and delineating the design and artistic components of the data visualizations. Furthermore, I was responsible for integrating the produced footage into a 3D model of the stage, facilitating a pre-visualization of the final result.
Storyboard
Animatics and Pre-visualizations.
3D render of the custom screens.


